What Is Digital Twin Architecture? Complete Guide & Examples

In this story
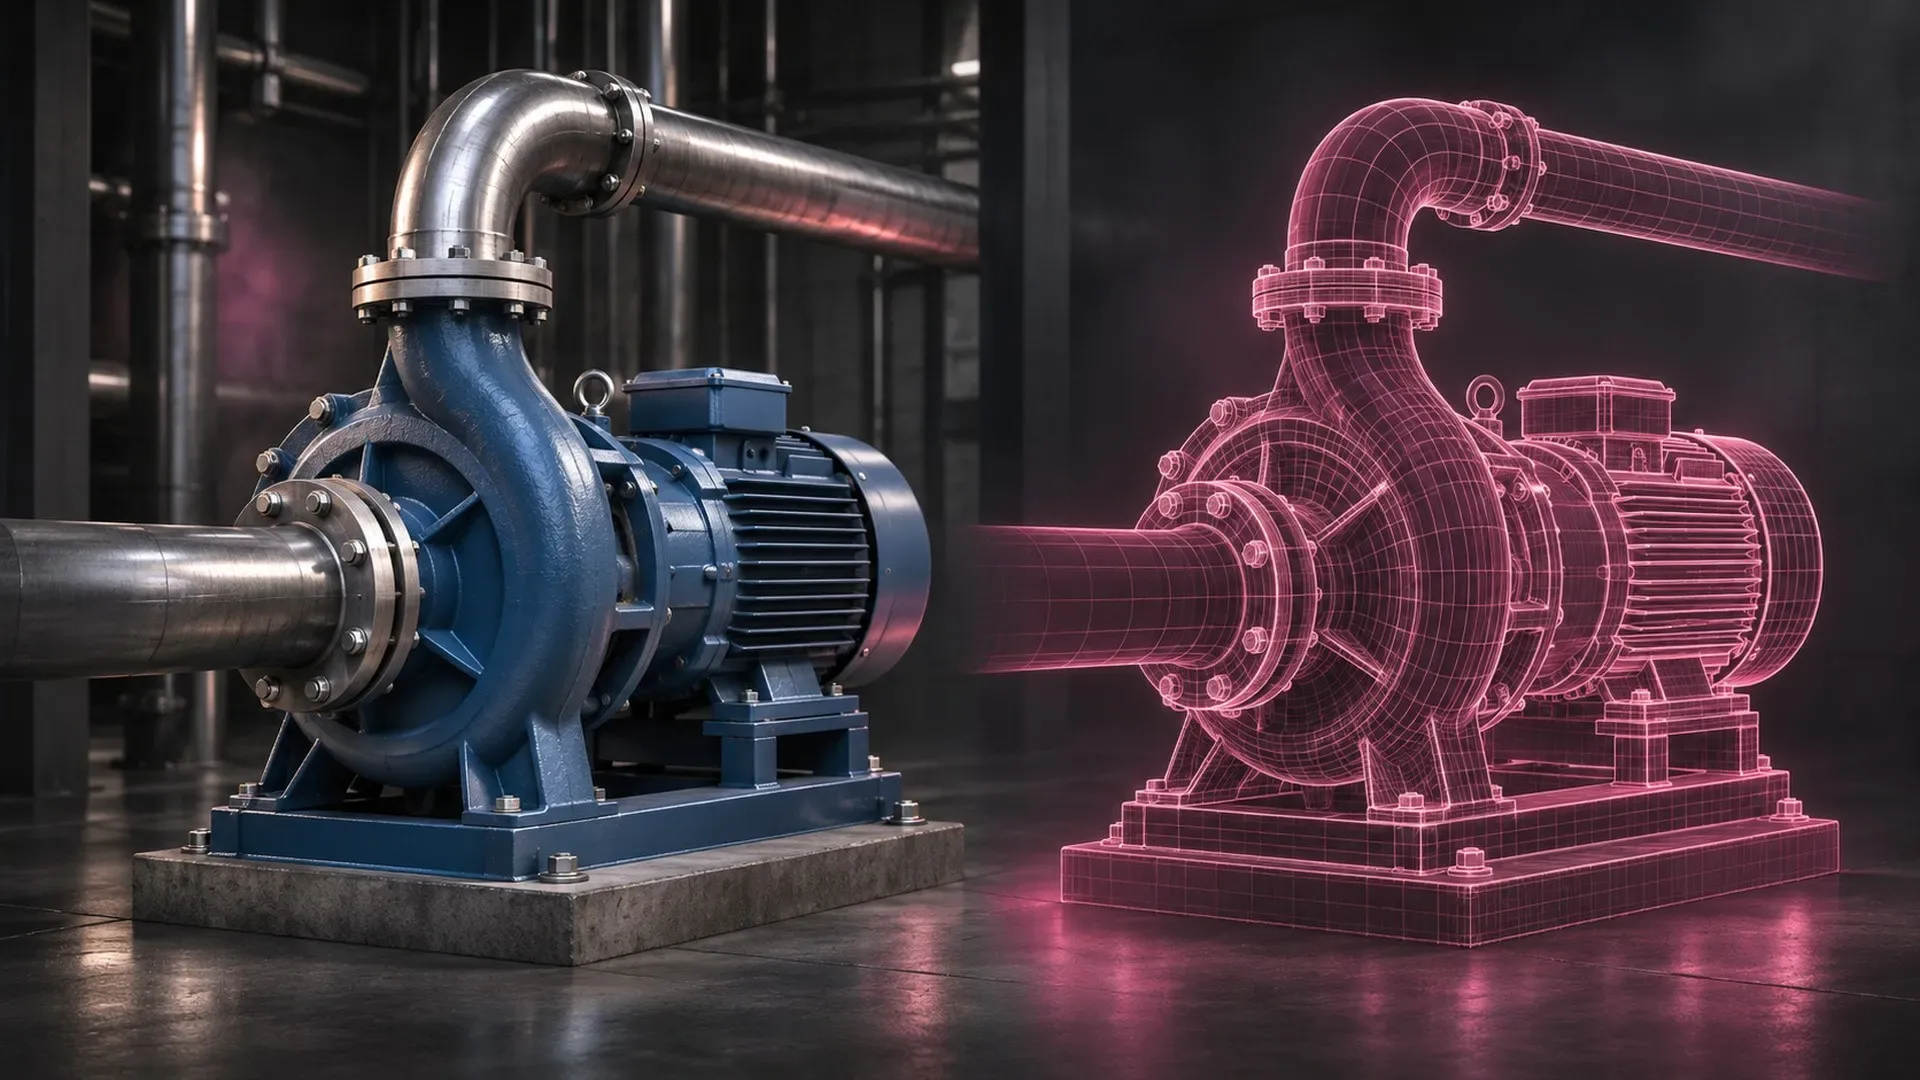
Digital twin architecture is the design that connects a physical asset, system, or process to a digital representation that updates as its real-world counterpart changes. It defines what to observe, how readings become a reliable picture of the asset, and how people or software use that picture. In a building’s heating loop, for example, it can show which pump is running, how much water is moving, and whether the flow reading is fresh enough to guide an inspection.
Four responsibilities sit behind that screen. Sensors and controllers observe the equipment. A data pipeline collects and checks their readings. A twin service maintains the model and state. Applications use that state to monitor conditions, test scenarios, or support decisions.
Digital twin vs. BIM, simulation, and digital shadow
A building information model (BIM) can tell a facilities team where a pump is installed and which pipes it connects to. The operational twin can link those records to live measurements and maintenance history. A simulation answers a different question, such as what would happen to flow if a valve position changed. A twin can use a simulation and supply it with the latest measured conditions. Autodesk’s guide to BIM and building twins.
A one-way feed from equipment into a model is often called a digital shadow. The Digital Twin Consortium framework uses the term digital twin system for two-way synchronization. Manufacturing guidance emphasizes synchronization and fitness for purpose. When reviewing an architecture, ask what updates in each direction. The pump example in this guide starts with a read-only monitoring path.
How digital twin architecture works
The diagram follows a reading from the pump to the operator’s screen. A small deployment might run the pipeline and twin service on the same computer. A larger deployment might collect data at each site and maintain a shared model elsewhere.
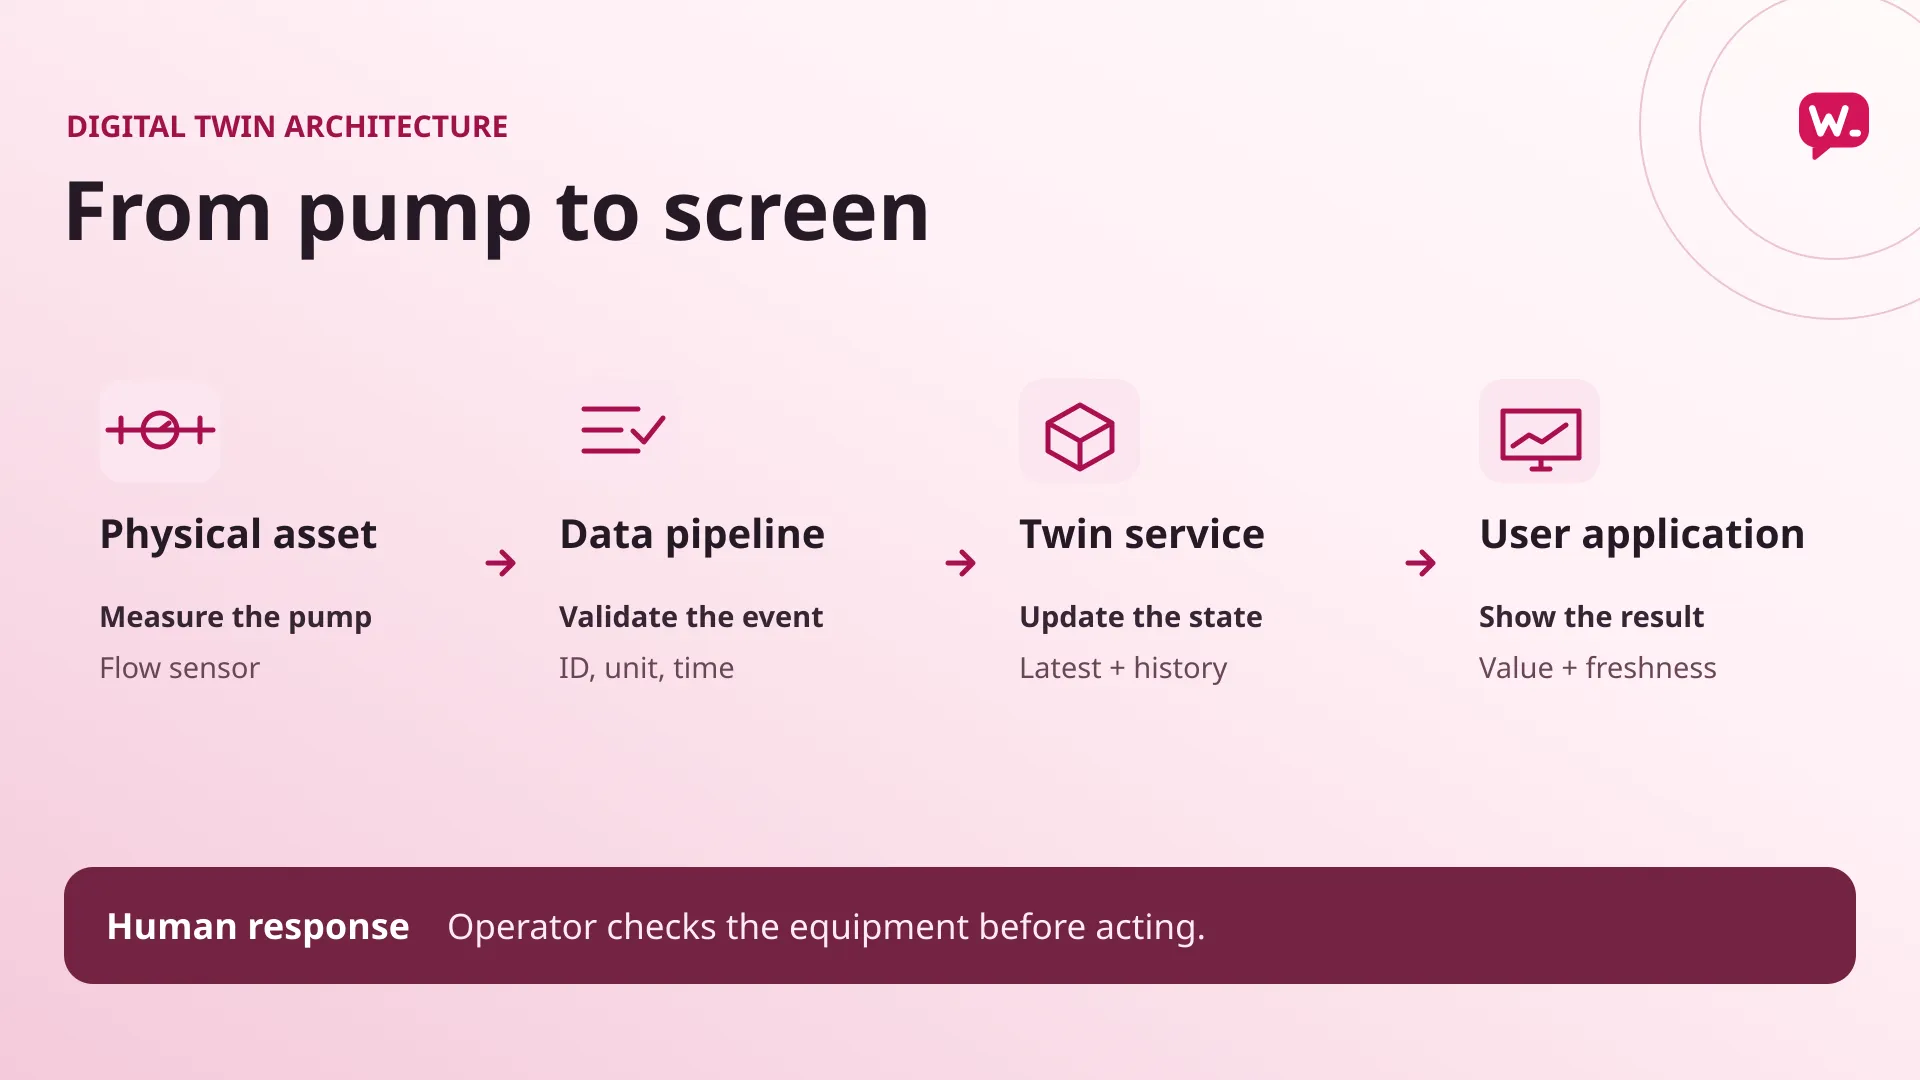
1. Physical assets and sensors
Define the asset and the observations it can provide. A flow sensor measures water moving through a pipe. A controller can report whether the motor is running. A sensor on a shared outlet may describe the whole loop, so record which pipe and equipment each signal actually represents. How biosensors turn physical changes into measurable signals.
2. Data collection and ingestion
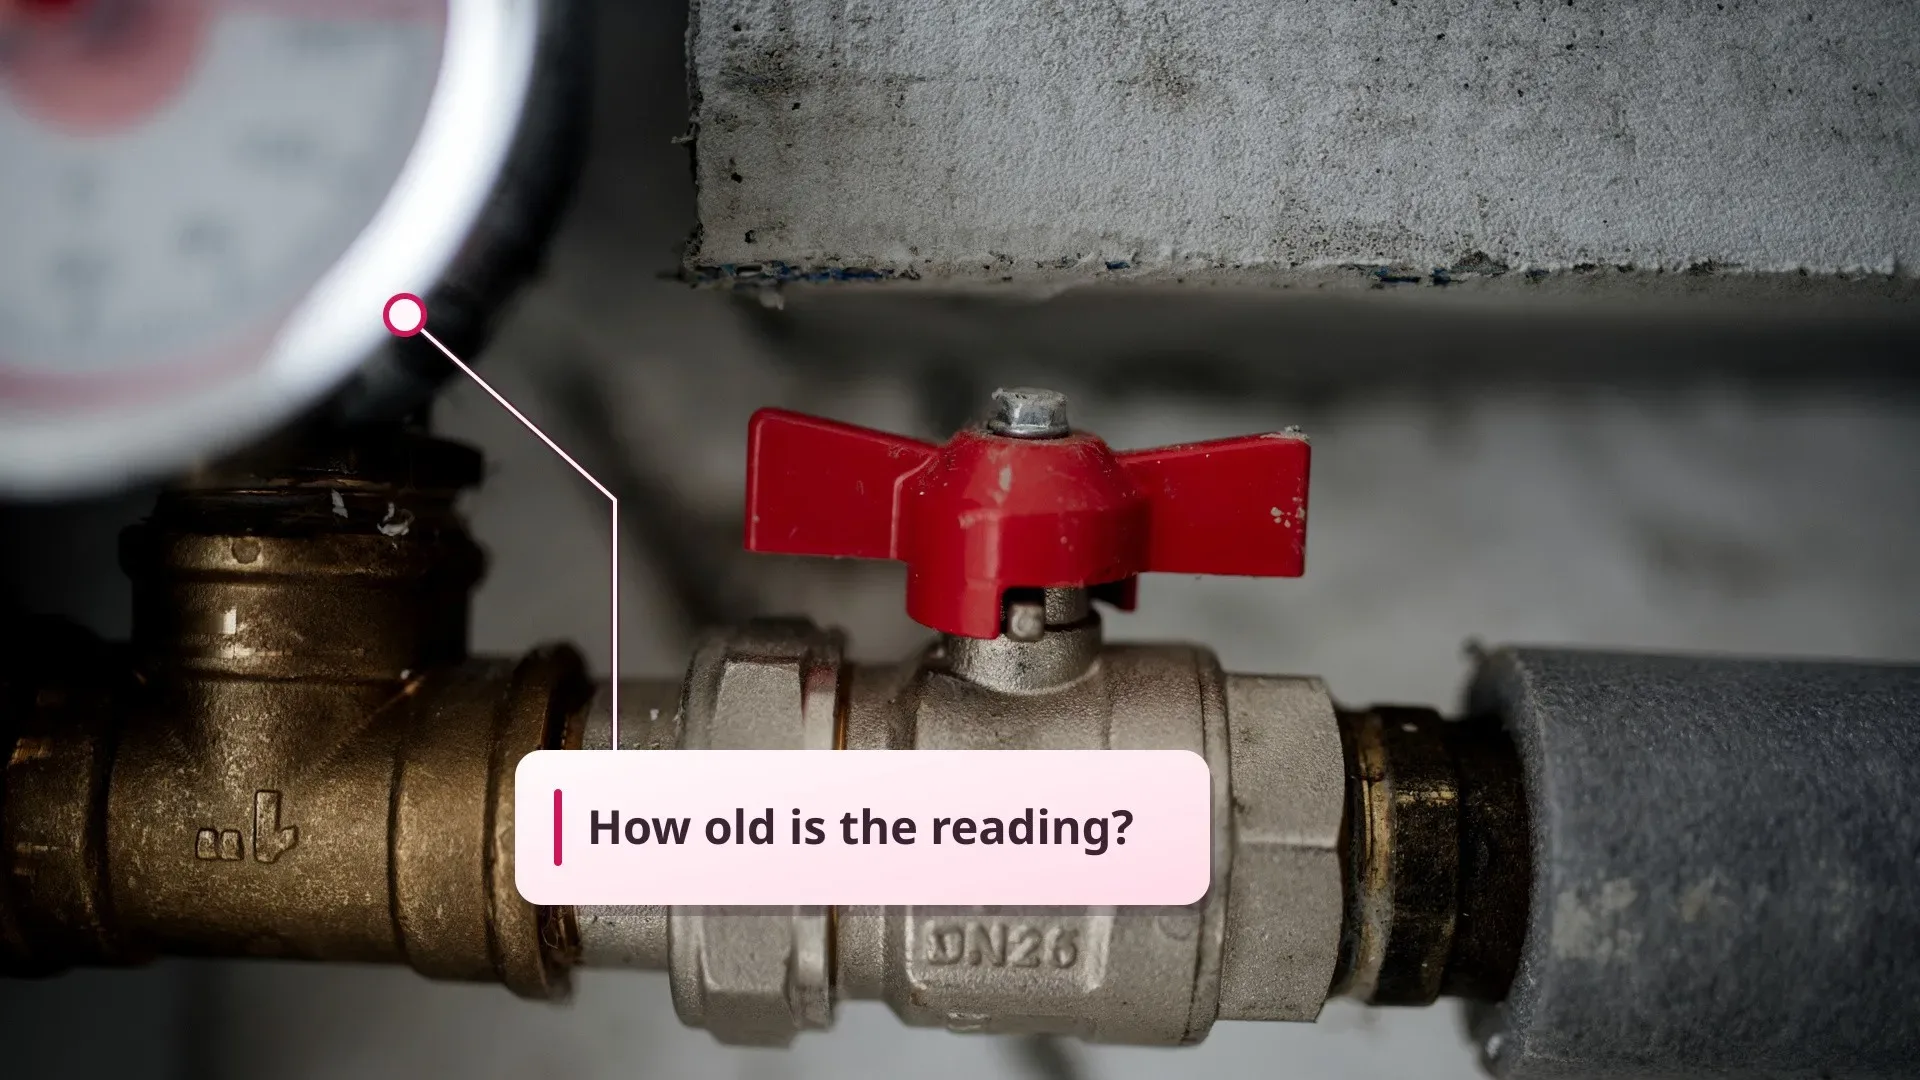
A gateway or collector receives readings. The ingestion layer checks the asset identifier, measurement unit, time, and quality. When connectivity drops, a collector with local buffering can send stored readings after it reconnects. Measurement time tells the service how old each of those readings is.
3. Twin model, latest state, and history
The model records what each asset is and how it relates to others. Pump P-17 serves heating loop H-2, for example. The latest state stores accepted measurements for quick use and the history records how those measurements changed. Microsoft’s Azure Digital Twins documentation illustrates how a graph can represent asset relationships.
4. Applications and feedback
Dashboards, maintenance tools, and simulations consume the state. A screen should show a measurement with its time and freshness. If a system sends updates or requests back, the architecture defines which service has permission to do so and how the operator or application sees the outcome.
Read More:
What Is Humanoid Robot Design?
Embodied AI Explained With Examples
Digital twin architecture example for a circulation pump
A building operator wants to know whether the circulation pump is delivering water while its motor is running. Suppose P-17 sends a flow measurement every 10 seconds and its screen marks a reading stale at 30 seconds of age. These are example settings. A real project sets both intervals based on how quickly the equipment changes and how much delay the operator can tolerate.
Each event contains the asset ID, flow in liters per minute, measurement time, and sensor quality. The service records arrival time too. Measurement time determines the newest valid observation. Arrival time shows when the service got it.
Event | Dashboard state | Why |
10:00:10 · A flow reading of 41 L/min arrives immediately | 41 L/min, current | The new reading becomes the latest accepted observation. |
10:00:45 · The connection has dropped | 41 L/min, stale | The last measurement is 35 seconds old. |
10:01:01 · A 37 L/min reading taken at 10:01:00 arrives | 37 L/min, current | The reading is one second old. |
10:01:02 · A buffered 40 L/min reading from 10:00:20 arrives | 37 L/min, current | The buffered reading belongs in history. The newer observation still drives the display. |
Show “no data” until the system receives its first valid measurement. If flow is stale and motor status is current, label the two independently. A running motor with fresh low flow gives the operator a different reason to investigate than a running motor with a missing flow reading.
Four types of digital twins and when to use each
The four categories below describe what the twin represents, from a part to an entire workflow. The right scope depends on the decision. A pump model can support a pump inspection. Estimating whether the whole building can hold room temperature may require the heating loop, boilers, and information about demand. AWS’s breakdown of digital twin types.
Type | What it represents | Example question |
Component twin | One part, such as a pump bearing | Is vibration changing during comparable operating periods? |
Asset twin | An individual machine or assembly | Is this pump delivering its expected flow? |
System twin | Multiple assets working together | Can the heating loop maintain flow if one pump goes offline? |
Process twin | An operational sequence or workflow | Where do queues form as jobs move through a production line? |
Buildings and infrastructure use cases
A building twin can link BIM asset IDs to meter readings, room sensors, and equipment status. If a floor is overheating, the facilities team can move from the complaint to the zone that serves the floor, then inspect the air handler and its observations. This depends on maintaining the connections between spaces and equipment when layouts change.
For rail or utility networks, geography can be part of the model. A geospatial twin can tie an asset to its location, the network around it, and nearby infrastructure. Esri describes how the Cross River Rail team in Brisbane visualized existing infrastructure above and below ground while designing an underground railway. The relevant architectural choice is linking the different datasets to the same places. Esri’s Cross River Rail example.
Digital twin reference architectures and standards
For manufacturing, ISO 23247-2 provides a reference architecture. Its main domains cover the manufacturing elements being observed, the interface that communicates with equipment, the twin itself, and those who use it. Use the reference to assign responsibilities and check where information crosses a boundary. NIST’s ISO 23247 implementation scenarios show how those responsibilities map to shop-floor cases.
Across those cases, the same domain can be implemented with different tools. A cloud diagram may name a service for each responsibility. To compare it with a site-based design, first match how both collect data, update state, and deliver a result to a user.
How to design a digital twin people can trust
Start with one decision and a data contract
Write the operator’s decision in one sentence. Then list the observations it requires, including their source, unit, expected interval, accepted quality values, and owner. Give the physical asset and its sensors separate identifiers. If a technician replaces a sensor, keep the pump’s history attached to the pump and record when the measurement source changed.
Plan for duplicates and bad clocks. A stable event identifier helps the service recognize a retry and count the observation once. A timestamp check can flag a future-dated event before it is accepted as the latest state. For shared equipment, map each reading to the part of the system it measures and decide which applications are allowed to interpret it.
Separate recorded, predicted, and approved information
A simulation might predict how flow will change after a valve adjustment. Give the prediction its own label, inputs, time, and model version. Compare its output with measurements from comparable conditions before using it to guide decisions. When both values appear on a screen, show where each came from. WhatTheTech’s guide to checking the source of a claim.
A monitoring application can support a person’s decision to investigate. A request to change equipment settings needs a defined authority and a way to verify the outcome. Local control and equipment protection should remain available when the twin service or network goes offline. NIST’s guide to operational technology security.
The distinction also matters when a twin supports an embodied AI system. A robot might use a simulated environment for training or planning. The robot’s own sensors and controls handle its interaction with the physical environment.
Choose where state needs to be available
A collector at the site can buffer observations if its connection to a central service drops, provided that the collector and local network still work. If an operator needs a current view during the outage, that application also needs access to local state. A central service can make cross-site comparisons easier. In both setups, document how much data can be buffered and what the user sees if the buffer is full.
How to test digital twin architecture before rollout
Use one asset and rehearse the failures that affect its operator. For P-17, replay the worked example in a test environment and check the screen, the latest-state record, and the stored history. Use the original measurement timestamps so a replay tests age and ordering as well as delivery.
Test case | Pass condition |
Stop new observations longer than the freshness window | The last value becomes stale at the defined threshold and retains its measurement time. |
Deliver an older reading after a fresh update | The history contains both valid readings. The newest observation still drives the current display. |
Retry delivery of an accepted event | The observation is present once and counted once in calculations. |
Send an unexpected unit or implausible timestamp | The event is held or rejected and the reason is visible to the team. |
Restart the service while the feed is offline | Recovered readings retain their measurement times and appear stale when applicable. |
Replace the measurement source in the model | The asset keeps its identity. Its history records the source change. |
Does a digital twin need real-time updates?
Set the update cadence around the decision, from seconds for some condition displays to a scheduled refresh for a planning view. Write down the expected cadence, when the data becomes stale, and what happens after missing readings arrive. A location view may need updates less often than flow or motor status. The timestamps in each view should make that difference visible.
What should the first deployment prove?
For the pump, first show that the operator can distinguish fresh low flow from a lost connection. To add a second pump, test that its identity stays separate and that shared meters describe the correct part of the loop. If the next version adds a forecast, check that the predicted values can be compared with actual measurements over time.
Keep reading
Reinforcement Learning Explained With a Worked Example
Reinforcement learning is a way to train an agent to choose actions that maximize expected cumulative reward. The agent interacts with an environment, receives...
What Is Biocomputing? How Biological Computers Work, Examples and Applications
In 2022, researchers connected living human and mouse neurons to a simulated Pong game and reported that the cultures changed their behavior with structured fee...
Gemini 4 Neon vs GPT-6.2 Sol: Speed Evidence and Three Practical Tests
Sol looks promising for turnaround, while Neon merits a trial when reasoning errors cause rework. Compare the published evidence and repeat three practical tests on your own work.