Example Example page built by Claude for this page, not by the AI named above. How we make examples
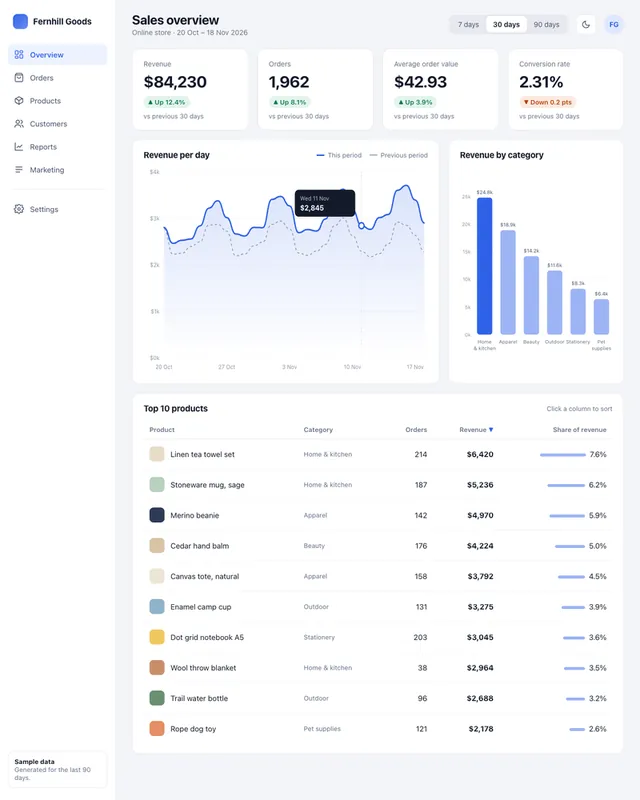
Analytics dashboard UI with live charts and filters
Get a working analytics dashboard with KPI cards, charts, a sortable table and date filters, filled with sample data.
You need
Nothing but the prompt
Written for
Claude, ChatGPT, Lovable
Result
Website
Prompt
You are a product designer and front-end developer. Build an analytics dashboard for what you track as one HTML file with inline CSS and vanilla JavaScript. Load a charting library from a public CDN.
Data: generate realistic sample data in JavaScript for the last 90 days, with weekly patterns and a little noise. The metrics are key metrics.
Layout:
- A left sidebar with navigation and a top bar with a date range filter (7, 30, 90 days) that updates everything.
- A row of KPI cards, each showing the value and the change against the previous period, with an arrow and color plus a text label (not color alone).
- A line chart over time and a bar chart by category.
- A sortable table of the top 10 items.
- A light and dark mode toggle.
Make it responsive (the sidebar collapses on phones), keyboard-accessible, and use colors that people with color blindness can tell apart. Keep the code tidy and commented so I can swap in my real data later.
Build an analytics dashboard for what you track with these metrics: key metrics. Use realistic sample data for 90 days. Include a sidebar, a 7/30/90-day filter that updates everything, KPI cards with change versus the previous period, a line chart, a bar chart, a sortable top-10 table and a light/dark toggle. Responsive, accessible and color-blind friendly. Structure the data so I can connect a real source later.
Fill in, or keep the brackets and change them later


 Claude, ChatGPT, Lovable